Getting Oriented
Note
This help should be accurate and comprehensive. If you see anything missing or that needs to be fixed, see How to Contribute or let us know in the Juice Slack #documentation channel.
What is Juicebox?
Juicebox is a new kind of tool for visualizing data. Organizations are so caught up in the race to capture and analyze data that they’re rushing past the most critical component – the end user. The best data in the world is useless if the everyday decision maker can’t understand it and interact with it.
So we said, “What if you stopped and took a more thoughtful approach to data visualization?”
- You would think conversation, not presentation. Instead of just presenting data, you would create more ways for people to interact with, socialize, and act on the data.
- You would create a more designful experience for the end user. The end product would feel a lot less like a spreadsheet or report – and a lot more like a social media platform.
- And you would deliver a complete solution, not a build-it-yourself kit. This means delivering a customized, fully configured data product – not a sophisticated demo and a box of parts.
Juicebox allows you to deliver that full data product experience to end users.
Juicebox isn’t intended for:
- Exploring data to discover what data you should present.
- Supporting lots of charts and configuration needs out of the box.
- Building applications for data scientists or data experts.
The Basics
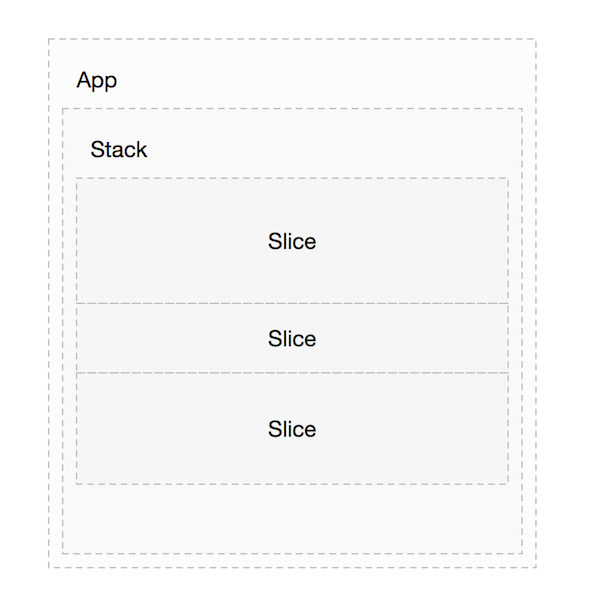
A Juicebox App is comprised of one or more Stacks. Each stack is a narrative path through special data visualization components called Slices. Slices can be rather complex or as simple as a sentence. Likewise, depending on how many slices you have in your data story, each stack could be very short and to the point, or take the user through deeper exploration.
Each slice in a stack requires a Data Service, which is the connection point between your Data Table and the requirements of your slice type and its configuration.
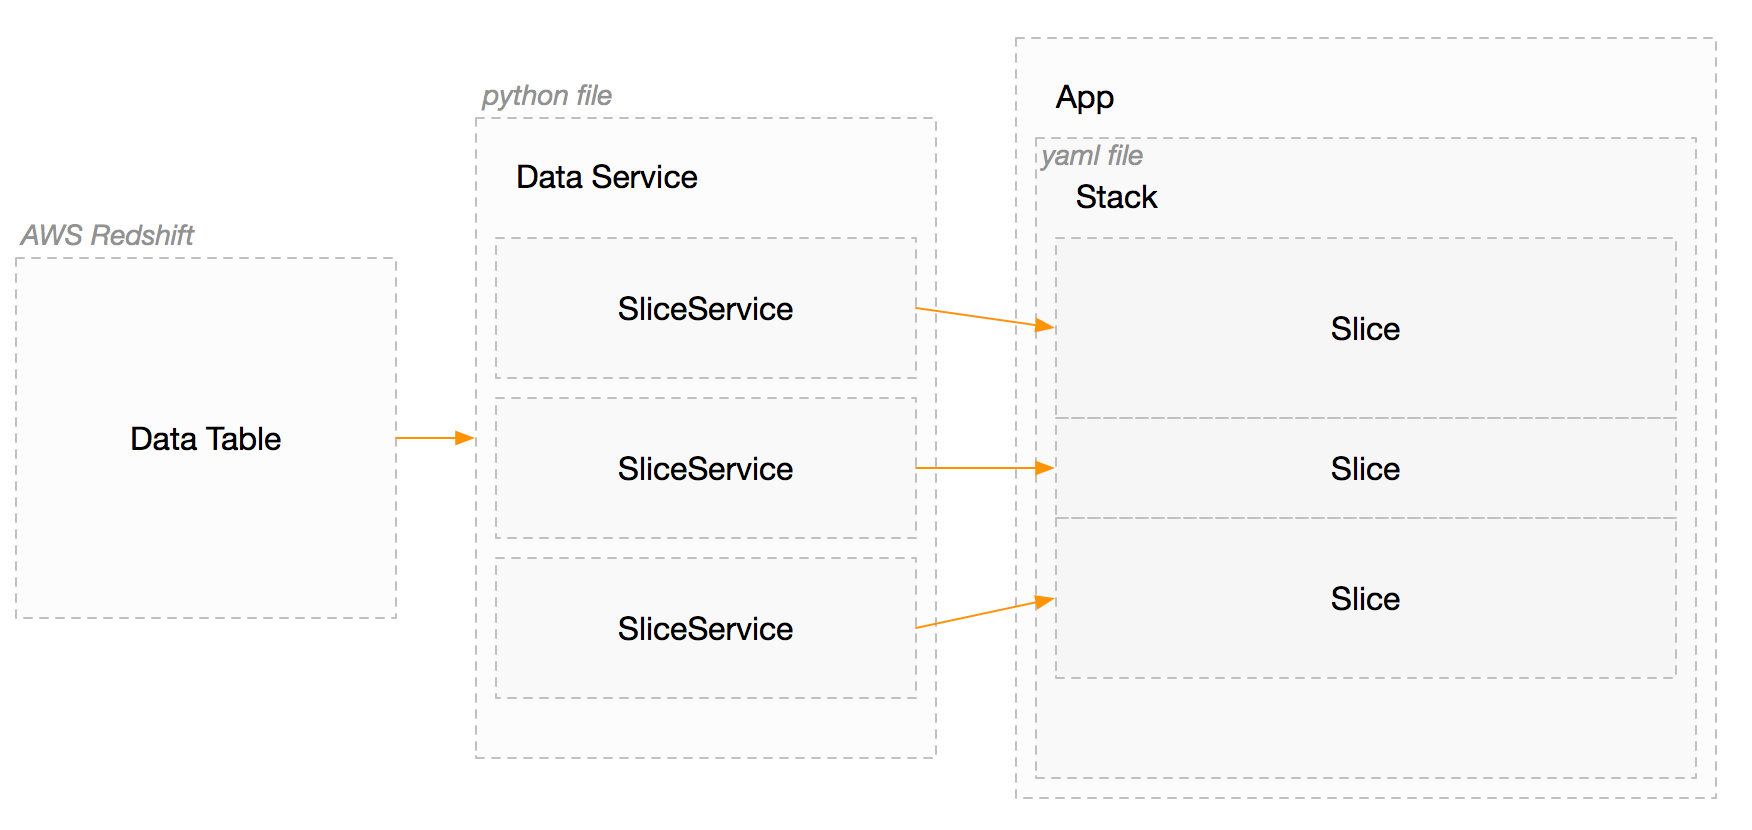
Here is a more detailed view of an app stack, and its pieces.
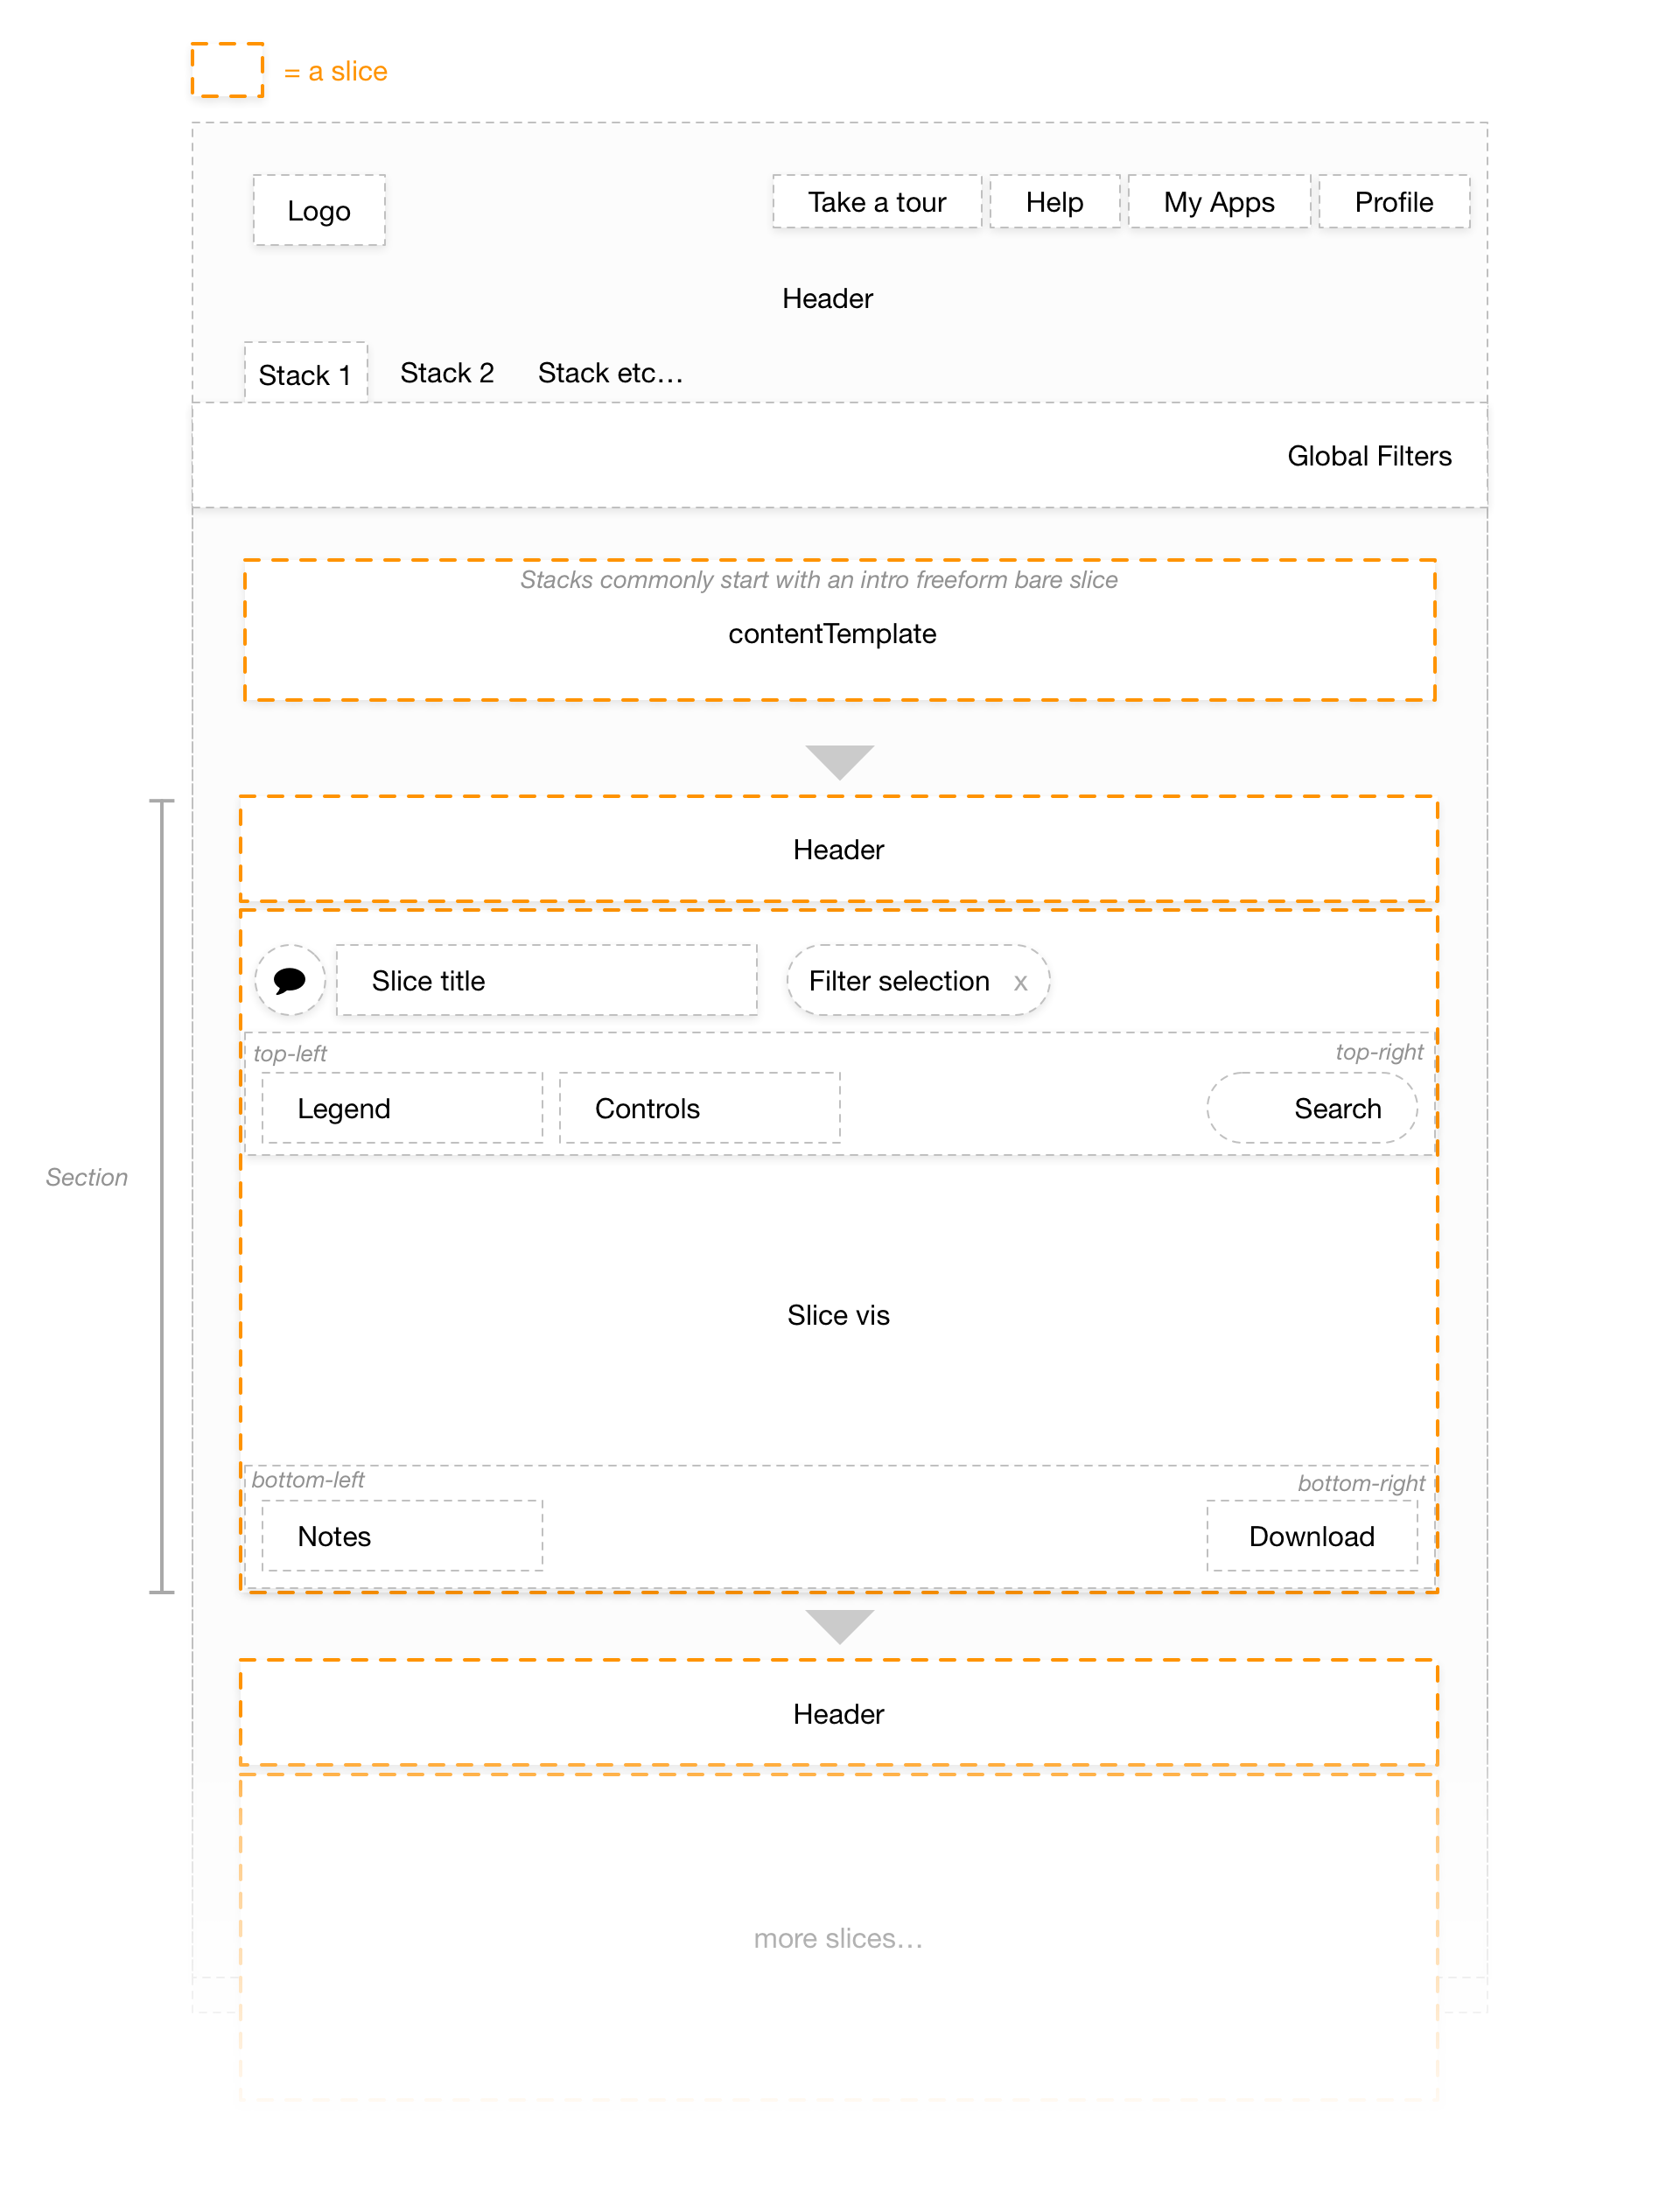
To review,
- Apps: Where everything connects.
- Stacks: Where slices connect, to explore the data.
- Slices: The core component, that presents data served to it.
See all common terms at the Juicebox Glossary.