Leaderboard
Warning
This help isn’t complete. It may even look terrible. If you want to work on it, see How to Contribute. You can also ask for help in the Juice Slack #documentation channel.
Contents
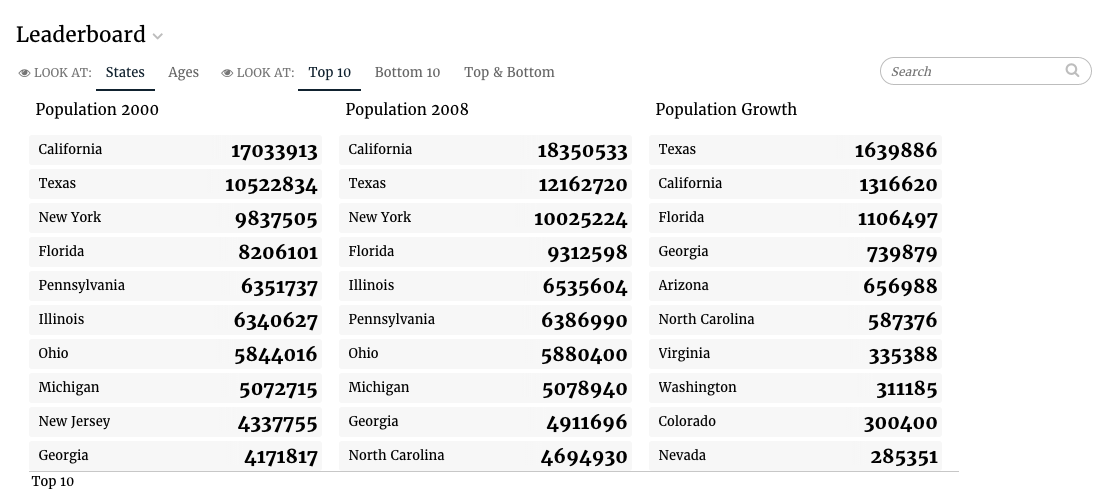
A Leaderboard slice is used to present the user with a view of the one or more values grouped by a common dimension and sorted. It allows a quick view of the Top 10, Bottom 10 and Top and Bottom 5.
Leaderboard config
Leaderboard slices support the Common configuration options for all slices. Additional options are:
columns
An array of column descriptions (in the order they need to be displayed in leaderboard). Each cell in Leaderboard consists of a Name and a Value of (eg. [StudentX 99] [StudentZ 23]). The name field for each cell should be specified as the first item in columns array. The first column (name field) will not be rendered in leaderboard, its field value rather becomes the name part in each cell. Your first column is NOT an ID or a numeric value, it should be a property name in each data item that has a string value. Value fields should be specified next, in the order they need to appear in the leaderboard.
| Optional: | Yes, but results might be unexpected (might pick the wrong name column) if columns not defined |
|---|---|
| Values: | An array of |
| Example: |
|
ignoreNulls
Should the null values be ignored?
| Optional: | Yes, defaults to |
|---|---|
| Values: | true|false |
| Example: | config:
ignoreNulls: false
|
showMode
Which records should leaderboard initially show? Top X? Bottom X? or Top X/2 and Bottom X/2?
| Optional: | Yes, defaults to |
|---|---|
| Values: | top|bottom|both |
| Example: | config:
showMode: both
|
numberOfRows
Number of rows displayed in leaderboard.
| Optional: | Yes, defaults to 10 |
|---|---|
| Values: | integer |
| Example: | config:
numberOfRows: 20
|
Flavors of Leaderboard
Default (leaderboard)
The default flavor renders a many metrics and dimensions grouped by a single dimension. The primary dimension is used as the grouping dimension.
The code for the default Trend flavor looks as follows for rendering multiple datasets:
class LeaderboardV3Service(CensusService):
    def build_response(self):
        self.metrics = ('pop2000', 'pop2008', 'popdiff')
        self.dimensions = ('state', )
        recipe1 = self.recipe().metrics(*self.metrics).dimensions(
            *self.dimensions)
        self.dimensions = ('age', )
        recipe2 = self.recipe().metrics(*self.metrics).dimensions(
            *self.dimensions)

        results = RecipePool([
            (recipe1, 'States'), (recipe2, 'Ages'),
        ]).run()
        self.response['responses'] = results
And the slice in stack.yaml:
- slice_type: "leaderboard"
  slug: "leaderboard"
  title: "Leaderboard"
  data_service: "someService.LeaderboardV3Service"