Table
Warning
This help isn’t complete. It may even look terrible. If you want to work on it, see How to Contribute. You can also ask for help in the Juice Slack #documentation channel.
Contents
A Table slice is used to present the user with a table view of the data. It currently only has a default flavor.
Table config
Table slices support the Common configuration options for all slices.
searchFields (table)
The data attributes to be used for searching.
Warning: If the slice is paginated, you will also need to add search_keys
to pagination config.
Here is config for an unpaginated slice.
| Optional: | Yes. Default is |
|---|---|
| Values: | An array of strings |
| Example: | config:
searchFields: ['label', 'score']
|
For a paginated slice, config would look like the following.
| Optional: | Yes. Default is |
|---|---|
| Values: | An array of strings |
| Example: | config:
searchFields: ['label', 'score']
pagination:
search_keys: ['label', 'score']
pageSize: 200
|
Setting column widths
After a table response has been renderered, the response will contain a top level property columns that is a list. For each column in that list you can set a width property (in pixels).
Under the hood juicebox uses SlickGrid for the table slice. It sets a SlickGrid option forceFitColumns to true.
As a result, the column widths are automatically adjusted and may be different from the value you specified.
To get the desired result, when specifying widths for the columns, it’s better to divide the viewport width (normally 1120px, could be different when for example the slice has ‘wide’ style) into the parts that are needed. So if the table is 1120px wide and there are two columns and they should display 60%-40% then one column’s width should be specified as 672 and the other column’s width as 448.
If a width is specified for one column then should be specified on all columns. Otherwise you will get unexpected results.
An example: The table slice is 1120px wide. The table has 4 columns. We want the 2nd column to be twice as wide as others are.
recipe = ....  # build your recipe
response = recipe.render()
for i, column in enumerate(response['columns']):
    if i == 1:
        column['width'] = 448
    else:
        column['width'] = 224
self.response['responses'].append(response)
references:
https://github.com/mleibman/SlickGrid/wiki/Grid-Options https://github.com/mleibman/SlickGrid/blob/v2.0/slick.grid.js#L937
Flavors for Table
Default (table)
The default flavor renders a table that contains all the dimensions in the supplied order followed by all the metrics in the supplied order.
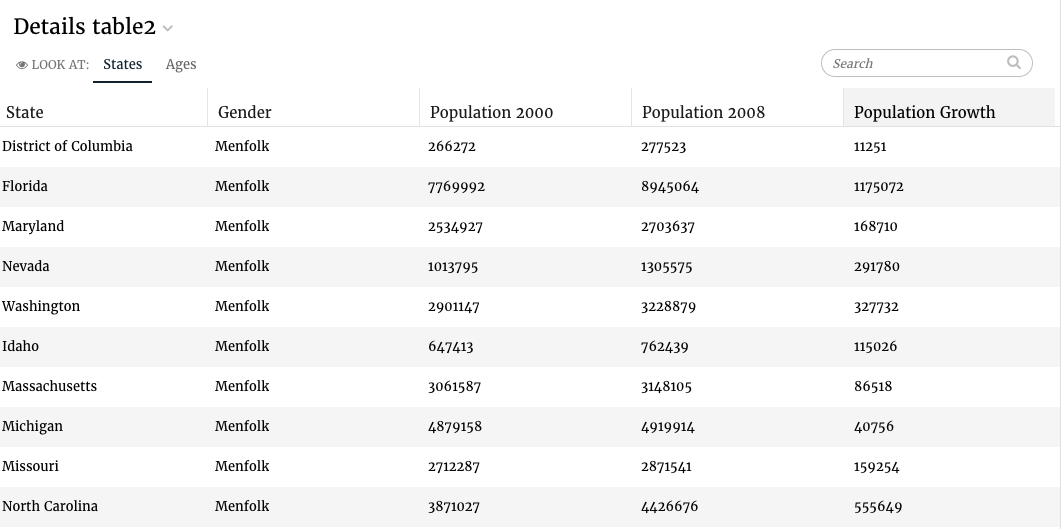
The code for the default flavor looks as follows:
class TableV3Service(CensusService):
    def build_response(self):
        self.metrics = ('pop2000', 'pop2008', 'popdiff')
        self.dimensions = ('state', 'sex')
        recipe = self.recipe().metrics(*self.metrics).dimensions(
            *self.dimensions)

        self.response['responses'].append(recipe.render())
The slice in stack.yaml:
- slice_type: "details-table"
  slug: "table23"
  title: "Details table2"
  config:
    "name_field": "state"
    "slickgrid_id_field": "row_id"
  data_service: "censusv2service.TableV3Service"
Including Summary data
Sometimes you will have the need to include a summary row to your table that shows the summarization of the metrics in the table, for e.g. the average of all the values for each column. Here we will walk through how you can accomplish that.
Response Structure
The summary data for a table needs to be included in the data service response of that
table as another item in the data array with a special name summary:
"data": [
    {
        "name": "items",
        "values": [
            { "age": 30, "pop2000": 210382 },
            { "age": 40, "pop2000": 203341 }
        ]
    },
    {
        "name": "summary",
        "values": [
            { "unique_ages": 2, "pop2000": 413723 }
        ]
    }
]
And the columns array in the response would need to contain a mapping of the
summary fields and their labels.
"columns": [
    {
        "field": "age",
        "name": "Age",
        "summary_field": "unique_ages",
        "summary_label": "Unique:"
    },
    {
        "field": "pop2000",
        "name": "Population 2000",
        "summary_field": "pop2000",
        "summary_label": "Sum:"
    }
]
Creating Summary data
Create an additional recipe that calculates the summary data along with the recipe that creates the data for the table.
Let’s look at an example. Below we have a Census table that contains population data for the years 2000 and 2008 across ages and gender for each state.
class Census(Base):
    __table__ = Table('census', Base.metadata,
                    Column('state', String(30), primary_key=True),
                    Column('sex', String(1)),
                    Column('age', Float()),
                    Column('pop2000', Float()),
                    Column('pop2008', Float()),
                    schema='demo', extend_existing=True)
And the following metrics and dimension shelves have been setup:
class BasicService(RecipeServiceBaseV3):
    metric_shelf = {
        'pop2000': Metric(func.sum(Census.pop2000),
                        singular='Population in the year 2000',
                        format=",.0f"),
        'pop2008': Metric(func.sum(Census.pop2008),
                        singular='Population 2008', format=".3s"),
    }

    dimension_shelf = {
        'state': Dimension(Census.state, singular='US State',
                        plural="US States"),
        'age': Dimension(
            Census.age, singular='Age', plural="Ages"),
    }

    # Automatically filter on these dimensions if they are selected.
    automatic_filter_keys = ('sex', 'state', 'age')

    def __init__(self, *args, **kwargs):
        super(BasicService, self).__init__(*args, **kwargs)
        self.Session = Session
The data service for our table that shows the population for the year 2000 for each age is:
class DetailsTableService(BasicService):
    def build_response(self):
        recipe = self.recipe().metrics('pop2000').dimensions(
            'age').order_by('-age')

        response = recipe.render()
        self.response['responses'].append(response)
Now create the recipe that calculates our summary data. Here we want the number of unique ages and the sum of the population for the year 2000 across all the ages.
Define a new metric in the metric_shelf to get the unique ages:
metric_shelf = {
    'unique_ages': Metric(func.count(distinct(Census.age)),
                          singular='Unique:', format=".0f"),
}
And add the summary recipe:
class DetailsTableService(BasicService):
    def build_response(self):
        recipe = self.recipe().metrics('pop2000').dimensions(
            'age').order_by('-age')
        response = recipe.render()

        recipe = self.recipe().metrics('unique_ages', 'pop2000')
        summary_response = recipe.render()
Combine the summary response with the table response. We do this using
the provided helper method create_summary_table_response(base_response, summary_response).
Note: This method expects the columns in the summary response to correspond with the columns in the base response. This means that the first column in the summary response should be the summary metric for the first column in the base response.
Import the helper method:
from dataservices.utils import create_summary_table_response
Then call it passing it the responses of the table and the summary:
class DetailsTableService(BasicService):
    def build_response(self):
        recipe = self.recipe().metrics('pop2000').dimensions(
            'age').order_by('-age')
        response = recipe.render()

        recipe = self.recipe().metrics('unique_ages', 'pop2000')
        summary_response = recipe.render()

        response = create_summary_table_response(response, summary_response)
        self.response['responses'].append(response)
The labels used for displaying the summary data will be taken from the labels of the metrics in the summary response.
You can however override them with a custom value by specifying a third parameter to create_summary_table_response
called summary_labels. This is a dictionary, mapping a metric id to its label.
class DetailsTableService(BasicService):
    def build_response(self):
        recipe = self.recipe().metrics('pop2000').dimensions(
            'age').order_by('-age')
        response = recipe.render()

        recipe = self.recipe().metrics('unique_ages', 'pop2000')
        summary_response = recipe.render()

        response = create_summary_table_response(response, summary_response,
                                                summary_labels={
                                                 'pop2000': 'Sum:'
                                                })

        self.response['responses'].append(response)