Ranked List (DEPRECATED)
Warning
This feature is not available in Juicebox 4 This feature has been removed from Juicebox 4 apps. This is deprecated and should only be used if there’s a important client need for it.
Contents
Note
Use Ranked List v2 instead.
A Ranked List slice is used to show the user how the data compares to one another based on some metric across a dimension. It renders as a ranged slider or a bar chart depending on the usage.
Ranked list config
Ranked list slices support the Common configuration options for all slices. Additional options are:
disableSort (ranked list)
Should the data be sorted by value in descending order?
| Optional: | Yes, default is |
|---|---|
| Values: | true|false |
| Example: | config:
disableSort: false
|
min_value (ranked list)
Base value of the bars (eg. set it to 0 (zero), bars will be 0-based)
| Optional: | Yes, default is the minimum value within data (might not be 0) |
|---|---|
| Values: | number |
| Example: | config:
min_value: 0
|
max_value (ranked list)
Max value of the bars
| Optional: | Yes, default is the maximum value in data |
|---|---|
| Values: | number |
| Example: | config:
max_value: 1000
|
markers (ranked list)
An array of {x1,x2,label,tooltipContent} objects that draw a marking area
behind the bars. Usually used to draw target area. x1 and x2 are on the same
scale we use to draw the bars
| Optional: | Yes |
|---|---|
| Values: | JS object |
| Example: | config:
markers: [{\"x2\":1,\"tooltipContent\":\"Target: <strong>80.0%+</strong>\",\"x1\":0.8,\"label\":\"target\"}]
|
showCount (ranked list)
Should the number of included items in the bar be shown in the sub-value (eg. 28 students)?
| Optional: | Yes, default is |
|---|---|
| Values: | true|false |
| Example: | config:
showCount: false
|
Flavors for Ranked List
Default (ranked list)
Due to the requirements of the Ranked List, there is not a default flavor presently.
Value Scale (ranked list)
The value scale flavor is used when you have a flat structure with a list of values and a corresponding scale.
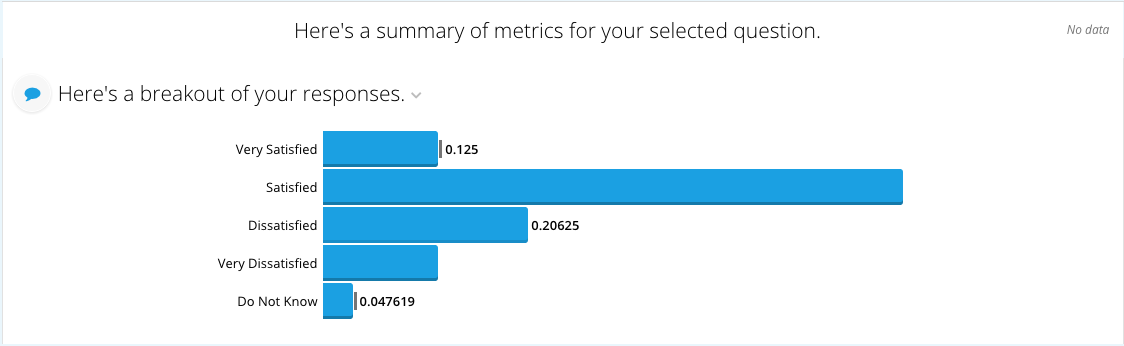
The code for the value scale flavor looks as follows:
class RankedList2Service(EIService):
    def build_response(self):
        self.metrics = ['value1', 'value2', 'value3', 'value4', 'value5',
                        'scale1', 'scale2', 'scale3', 'scale4', 'scale5']

        recipe = self.recipe().metrics(*self.metrics)

        self.response['responses'].append(recipe.render('Scores',
            flavor='value_scale'))
The slice in stack.yaml:
- slice_type: "ranked-list"
  slug: "responses"
  title: "Here's a breakout of your responses."
  config:
    "disableSort": true
  style:
    - "section-content"
  data_service: "EIDataServices.RankedList2Service"
The value scale flavor supports an optional render_config option
has_counts.
The code for the value scale flavor with counts looks like this. There needs to be an extra set of metrics representing counts.
class RankedList2Service(EIService):
    def build_response(self):
        self.metrics = ['value1', 'value2', 'value3', 'value4', 'value5',
                        'scale1', 'scale2', 'scale3', 'scale4', 'scale5',
                        'count1', 'count2', 'count3', 'count4', 'count5']

        recipe = self.recipe().metrics(*self.metrics)

        self.response['responses'].append(recipe.render('Scores',
            flavor='value_scale', render_config={'has_counts': True}))
Single Dimension (ranked list)
The single dimension flavor renders a ranked list using a single dimension for the group and a metric as the value for determining the position in the list. It also optionally accepts a second metric that is used as a value displayed by the dimension.
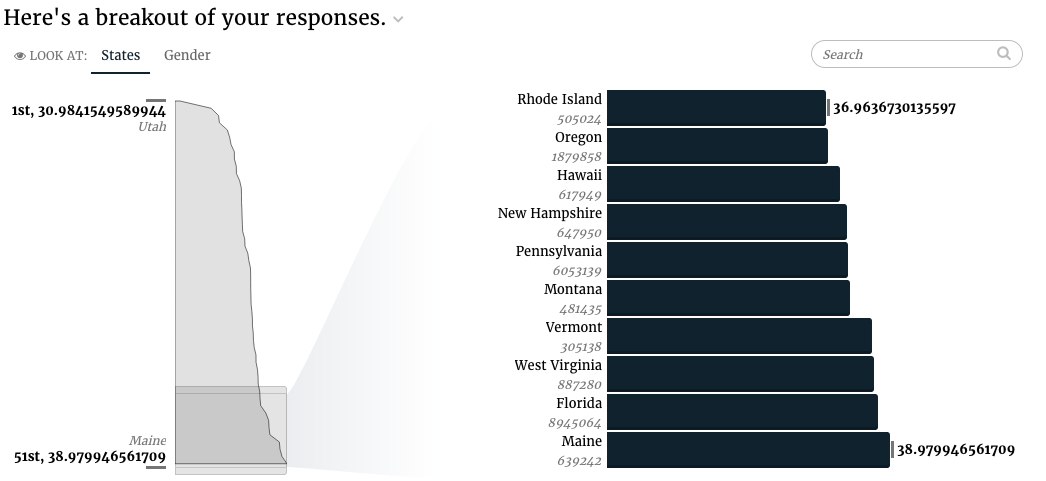
The code for the single dimension flavor looks as follows:
class RankedListV3Service(CensusService):
    def build_response(self):
        self.metrics = ('avgage', 'pop2008')
        self.dimensions = ('state', )
        recipe = self.recipe().metrics(*self.metrics).dimensions(
            *self.dimensions).order_by('avgage')

        self.response['responses'].append(recipe.render())
The slice in stack.yaml:
- slice_type: "ranked-list"
  slug: "COOKIES"
  title: "Here's a breakout of your responses."
  config:
    "disableSort": true
  style:
    - "section-content"
  data_service: "censusv2service.RankedListV3Service"