Timeseries
Contents
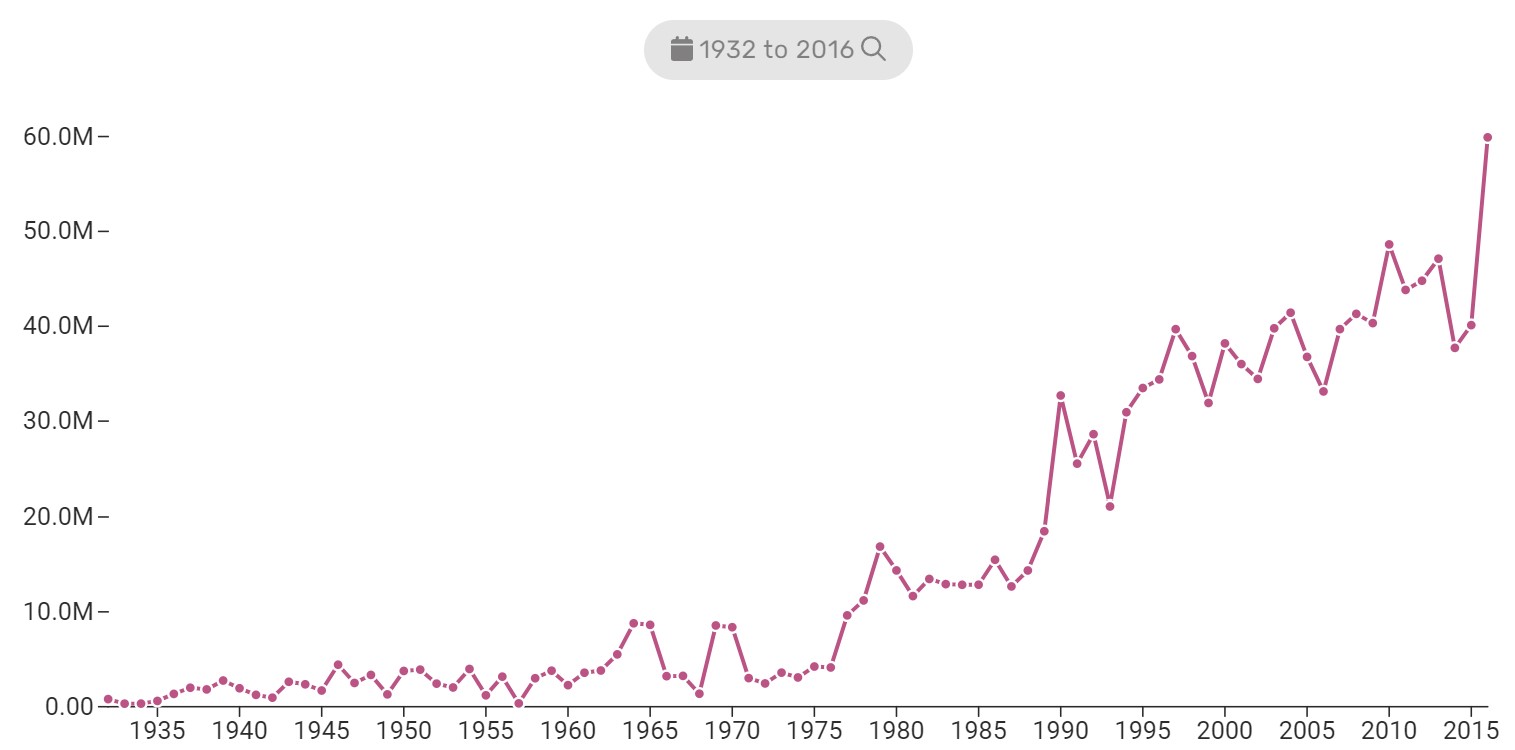
The timeseries slice is a simplified version of the trend slice developed for self-service apps. It supports a primary and secondary axis.
Timeseries Config
Time Series slice support the Common configuration options for all slices. The recipe must include a single Dimension built using a Date or DateTime.
yOptions
Configuration for the primary y axis. This is an object with four possible keys.
yMin
yMax
nice
startAtZero
config:
  yOptions:
    yMin: 10
    yMax: 50
    nice: false
    startAtZero: false
This presentation https://docs.google.com/presentation/d/1I0yI9BOiwX8G657V65NrregHKApTxSFCuNr-KmJuLLk/edit#slide=id.p has more details about the yOptions config.
secondaryYOptions
Configuration for the secondary y axis. This config is the same as yOptions.
xAxisFormat
The default date formatting on the x-axis is automatic based on the width of the screen and the number of dates that are being shown.
xAxisFormat can have three possible values.
'auto': The default, the format is based on the width of the screen and number of dates shown.'dimension': Use the dimension’s format.'{a strftime string}': Use an explicit strftime string. See https://strftime.org/ for possible values.
This presentation https://docs.google.com/presentation/d/1I0yI9BOiwX8G657V65NrregHKApTxSFCuNr-KmJuLLk/edit#slide=id.p has examples.
Using the secondary axis
All series will plot on a shared y axis by default. You can set a single series to plot on a secondary axis using render config.
recipe = self.recipe().dimension('year').measures('budget', 'marketing_budget', 'profit')
return recipe.render(
  name='Dates',
  flavor='default',
  secondary_measure='profit'
)
In this example, budget and marketing_budget will plot on the default y axis and profit will
plot on the secondary axis.
A Sample Data Service
The timeseries slice was built for juicebox 4 / self-service apps. It looks like this.
The code for a data service of the default timeseries flavor looks like this
def build_response(self):
    recipe = (
        self.recipe()
        .dimensions("srvc_month")
        .metrics("procedure_count")
        .order_by("srvc_month")
    )
    self.response["responses"].append(recipe.render(flavor="default", name="Dates"))
This slice was built for self-service apps which decorate ingredients with a
role. If you’re using this slice in a custom app, you need to add the role explicitly
on the shelf as follows:
shelf = Shelf(
    {
      "srvc_month": Dimension(
          Medtech.srvc_month,
          singular="Month",
          plural="Months",
          format="%b %Y",
          role="dimension:time",
      ),
      ...
Finally, the slice in slice yaml may look like this:
- slice_type: timeseries
  slug: timeseries
  title: "Changes over time"
  data_service: group_service.TimeSeries
  config:
    display_slice_as: default
    collapsable: false