Ranked List v2
Warning
This help isn’t complete. It may even look terrible. If you want to work on it, see How to Contribute. You can also ask for help in the Juice Slack #documentation channel.
A Ranked List v2 slice is used to show the user how the data compares to one another based on some metric across a dimension. It renders as a ranged slider or a bar chart depending on the usage.
Ranked list v2 config
Ranked list slices support the Common configuration options for all slices. Additional options are:
disableSort (ranked list v2)
Should sorting by value be disabled in this ranked list.
| Optional: | Yes, default is |
|---|---|
| Values: | true|false |
| Example: | config:
disableSort: true
|
min_value (ranked list v2)
Base value of the bars (eg. set it to 0 (zero), bars will be 0-based)
| Optional: | Yes, default is the minimum value within data (might not be 0) |
|---|---|
| Values: | number |
| Example: | config:
min_value: 0
|
max_value (ranked list v2)
Max value of the bars
| Optional: | Yes, default is the maximum value in data |
|---|---|
| Values: | number |
| Example: | config:
max_value: 1000
|
showCount (Deprecated, support will drop in JB4)
Should the number of included items in the bar be shown in the sub-value (eg. 28 students)?
| Optional: | Yes, default is |
|---|---|
| Values: | true|false |
| Example: | config:
showCount: false
|
colorRange
An array of two color values: [color for negative bar values, color for positive bar values]. Colors can be represented as hex values (eg. “0xff00aa”), rgb (eg: “rgb(1,1,1)”) or named colors (eg: “red”)
| Optional: | Yes, default is [‘#FD938B’, ‘#84BB38’] |
|---|---|
| Values: | array of two color values |
| Example: | config:
colorRange:
- "red"
- "green"
|
itemTemplate
Name of the template that would be used to render ranked list row label
| Optional: | Yes, there is a default template that would render the label |
|---|---|
| Values: | CSS selector |
| Example: | config:
itemTemplate: "#custom-item-template"
|
markers (not a config option)
Markers are the area blocks (only area drawing is supported in Ranked list) that are drawn on the ranked list area plot. Markers are NOT a config option since JB3. In order to define a marker, the service needs to return a markers object in the data response. Feature was added in: https://github.com/juiceinc/fruition/pull/679
| Optional: | Yes |
|---|---|
| Values: | A typical marker object is defined by the following properties:
|
| Example: | "data": [
{
"name": "items",
"values": [...]
},
{
"name": "markers",
"values": [
{
"x1": -200,
"x2": -100,
"label": "target",
"tooltipContent": "Target Range <strong>-200-0</strong>",
"position": "below",
"shape": "rect",
"classed": "slice-legend__goal"
}
]
}
]
|
Flavors of Ranked List V2
Default (ranked list v2)
Due to the requirements of the Ranked List, there is not a default flavor presently.
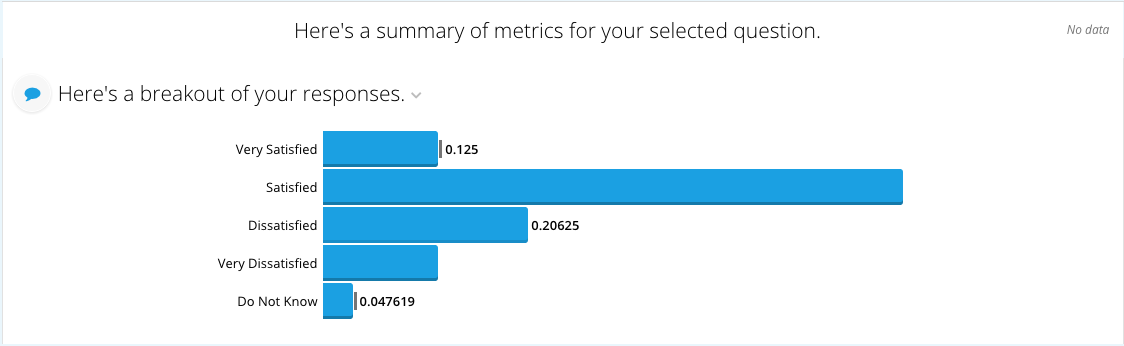
Value Scale (ranked list v2)
The value scale flavor is used when you have a flat structure with a list of values and a corresponding scale.
The code for the value scale flavor looks as follows:
TBD
The slice in stack.yaml:
- slice_type: "ranked-list-2"
  slug: "responses"
  title: "Here's a breakout of your responses."
  config:
    "disableSort": true
  style:
    - "section-content"
  data_service: "EIDataServices.RankedList2Service"
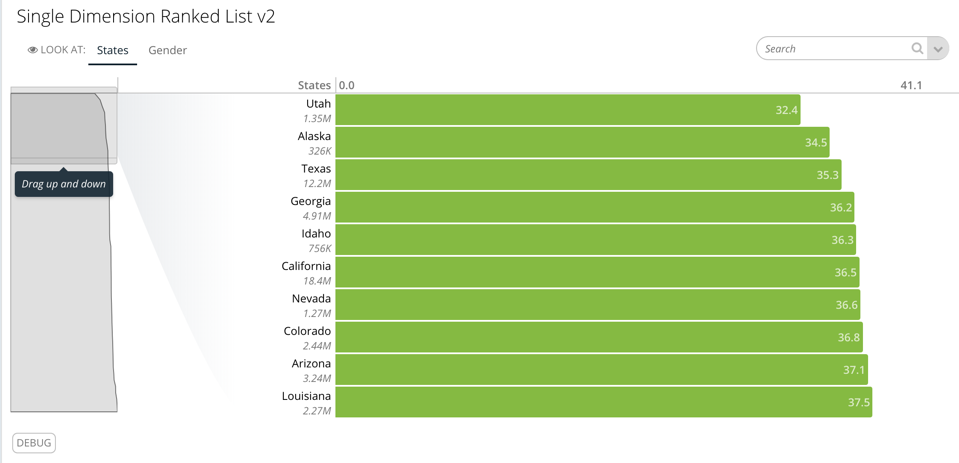
Single Dimension (ranked list v2)
The single dimension flavor renders a ranked list using a single dimension for the group and a metric as the value for determining the position in the list. It also optionally accepts a second metric that is used as a value displayed by the dimension.
The code for the single dimension flavor looks as follows:
class RankedListV3Service(CensusService):
    def build_response(self):
        start = current_milli_time()
        self.metrics = ('avgage', 'pop2008')
        self.dimensions = ('state', )
        recipe1 = self.recipe().metrics(*self.metrics).dimensions(
            *self.dimensions).order_by('avgage')
        self.dimensions = ('sex',)
        recipe2 = self.recipe().metrics(*self.metrics).dimensions(
            *self.dimensions).order_by('avgage')
        results = RecipePool([
            (recipe1, 'States'), (recipe2, 'Gender'),
        ]).run()
        self.response['responses'] = results
        print 'Ms: ',current_milli_time() - start
The slice in stack.yaml:
- slice_type: "ranked-list-2"
  slug: "rankedlistv2"
  title: "Single Dimension Ranked List v2"
  config:
    "disableSort": True
  style:
    - "section-content"
  data_service: "censusv2service.RankedListV3Service"
  extra_css: ""